Abstract
Rationale and Objectives—Firefly luciferase (Fluc) reporter gene is an authentic marker forsurviving stem cells. However, it is unable to visualize the intramyocardial delivery of stem cells,nor their impact on cardiac function. We demonstrated that bioluminescence (BLI) combined withMR imaging (MRI) allowed better assessment of cell delivery and the impact on post myocardialinfarction (MI) remodeling.Materials and Methods—Murine embryonic stem cells (3 x 10 5 ) were double-labeled with Fluc and superparamagnetic iron oxide (SPIO) particles and injected into the infarct border zoneof athymic rat hearts.
Keywords: Myocardial infarction, Embryonic stem cells, Firefly luciferase, Superparamagnetic iron oxide, MRimaging, Bioluminescence

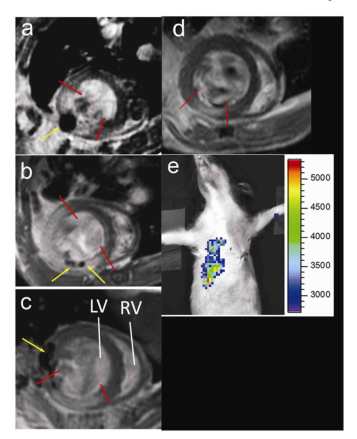
Fig.1. Distributions of grafted cells relative to infarct region revealed by MRI of ESC-treated group at day 1(a–c), and improper cell delivery revealed by BLI and MRI (d–e). One short axis slice is displayed for each heart. Infarcted region was marked between red lines. SPIO inducedhypointense region was indicated by yellow arrows. MRI revealed the exact location of grafted cells: in the center of the infarct (a), inside the infarct region but close to anterior border (b), or, in the lateral border next to the infarct region (c). The heart shown in (a) was from the non-graft subgroup while hearts in (b–c) from the engraftment subgroup. Improper cell delivery led to BLI signal from thoracic region and right upper abdomen (d,color scale in photons/s) and an absence of hypointense MRI signal in the myocardial wall (e). LV, RV = left, right ventricle.

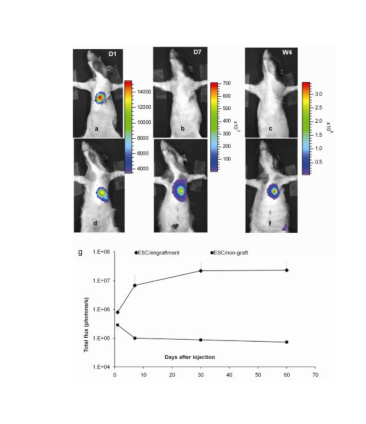
Fig.2. Diverged time courses of BLI signal intensity in ESC-treated group. Bioluminescence images from a heart in the non-graft subgroup (a–c) and one in engraftment subgroup (d–f) at day 1, 7 and week 4. The color scales are different for images at D1, 7 and W4 representing an order of magnitude increase in BLI signal intensity. g: total flux (photons/s) quantified from the engraftment subgroup (n=7) and non–graft subgroup (n=2). The non-graft subgroup and two animals from the engraftment subgroup contributed to the last time point (2-month) on the curve. Error bars represent values of standard deviation, and, for clarity, only the positive or negative portion is shown.
Tel : 028-8592-1823 (in China)
Tel:+1-517-388-6508 (in US)
Tel : +86 (28) 8592-1823 (outside of China)
Fax : +86-28-62491302
Zip code : 610041
Address: No.88, Keyuan South Road, Hi-tech Zone, Chengdu, Sichuan Province, China